
Portrait of a fascist state
Nothing has revealed the fascist state of mind in America as eloquently as Gov. Scott Walker of Wisconsin, who has been promised the budgetary concessions he wants from the working people of Wisconsin to resolve a looming deficit crisis, but insists on taking away the right of workers to bargain collectively over the terms of their employment. The protests are impressive, but what is depressive is the number of people who support this repeal of human rights to reduce their fellow citizens to a voiceless serfdom in a state that is run for the greediness for wealth and power of the super rich.
The resurgence of fascism in America has been obscured by the clamorous charges from the right wing about the socialism, Marxism, and lack of patriotism by President Obama and his adherents. The real facts about what America has become are recorded in the eleven charts below presented by Mother Jones that identifies with facts and statistics the decline of America into a fascist state.
The charts are reproduced below. For the whole story, click here: March/April 2011 Issue
How Rich Are the Superrich?
A huge share of the nation's economic growth over the past 30 years has gone to the top one-hundredth of one percent, who now make an average of $27 million per household. The average income for the bottom 90 percent of us? $31,244.
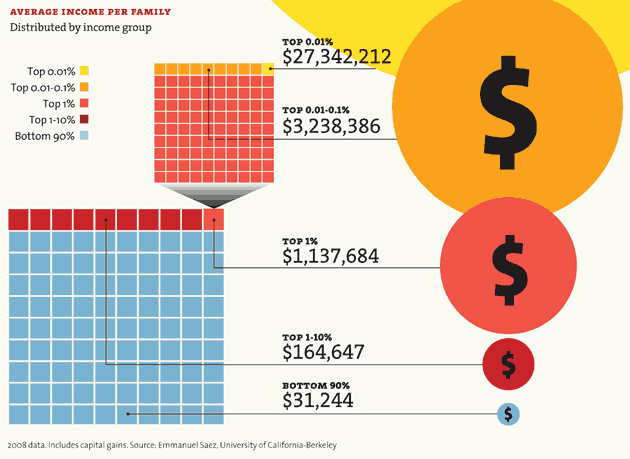

Note: The 2007 data (the most current) doesn't reflect the impact of the housing market crash. In 2007, the bottom 60% of Americans had 65% of their net worth tied up in their homes. The top 1%, in contrast, had just 10%. The housing crisis has no doubt further swelled the share of total net worth held by the superrich.
Winners Take All
The superrich have grabbed the bulk of the past three decades' gains.

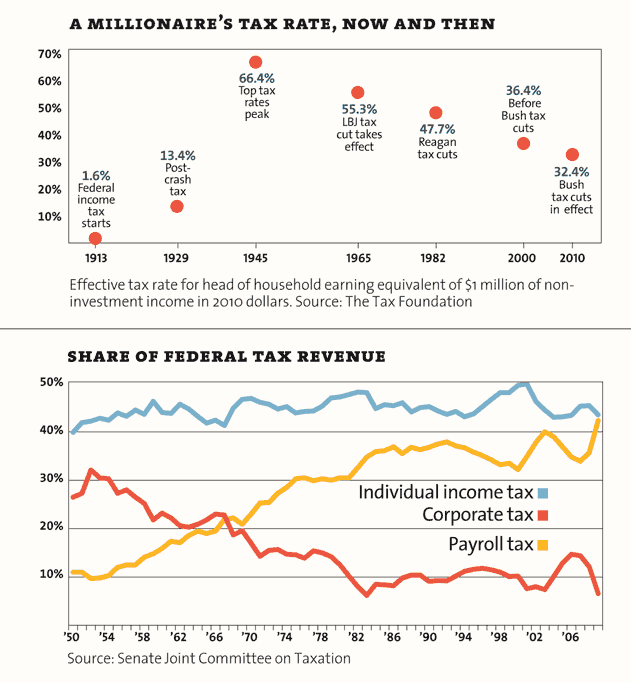
OUT OF BALANCE


Sources
Read also: Kevin Drum on the decline of Big Labor, the rise of Big Business, and why the Obama era fizzled so soon.
A Harvard business prof and a behavioral economist recently asked more than 5,000 Americans how they thought wealth is distributed in the United States. Most thought that it’s more balanced than it actually is. Asked to choose their ideal distribution of wealth, 92% picked one that was even more equitable.
Capitol Gain
Why Washington is closer to Wall Street than Main Street.
| member | max. est. net worth |
|---|---|
| Rep. Darrell Issa (R-Calif.) | $451.1 million |
| Rep. Jane Harman (D-Calif.) | $435.4 million |
| Rep. Vern Buchanan (R-Fla.) | $366.2 million |
| Sen. John Kerry (D-Mass.) | $294.9 million |
| Rep. Jared Polis (D-Colo.) | $285.1 million |
| Sen. Mark Warner (D-Va.) | $283.1 million |
| Sen. Herb Kohl (D-Wisc.) | $231.2 million |
| Rep. Michael McCaul (R-Texas) | $201.5 million |
| Sen. Jay Rockefeller (D-W.Va.) | $136.2 million |
| Sen. Dianne Feinstein (D-Calif.) | $108.1 million |
| combined net worth: | $2.8 billion |
Congressional data from 2009. Family net worth data from 2007. Sources: Center for Responsive Politics; US Census; Edward Wolff, Bard College.
Who's Winning?
For a healthy few, it's getting better all the time.
YOUR LOSS, THEIR GAIN
How much income have you given up for the top 1 percent?
Sources

1 comment:
Thanks for publishing this information. Of course, if you are a dirt poor person, you must vote Republican in the hope that you too will get that ticket to the land of milk and honey and huge tax breaks.
One might think that voting again and again for the same people who vote again and again for the plutocracy or the kleptocracy would cease making sense.
Voting for the rich and the trickle-down mythologists would seems to be the essence of insanity if you are not already obscenely rich.
Post a Comment